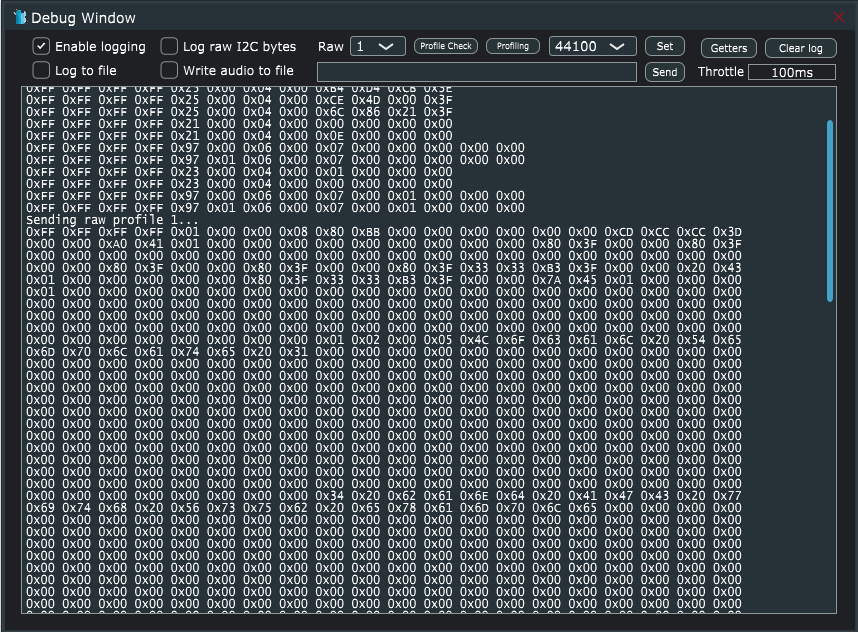
The debug window displays all communication between Profile Creator and the connected platform.
- Enable logging – Starts writing Tx and Rx bytes to the debug window.
- Log to File – Writes all bytes to a file located in C:\Users\<your user>\AppData\Roaming\Bongiovi\pc2.log
- Log raw I2C bytes – For NXP Dione/Dirana 3 platforms
- Raw profile transmission – Sends a full datablock (binary format) of a selected profile to the platform.
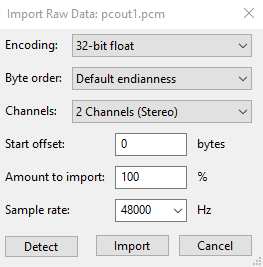
- Write audio to file – While in Local SDK Emulation mode, the processed audio may be written to a file located in C:\Users\<your user>\Documents\pcout
- The audio recording starts when the box is checked and stops when the box is unchecked.
- This file contains the raw samples output from the algorithm in float32 format.
- The audio may be imported into Audacity as Raw data using the following settings:
- Profile Check – Used to compare a preset loaded on the connected platform with the parameters in the UI. A diff is provided in a text file.
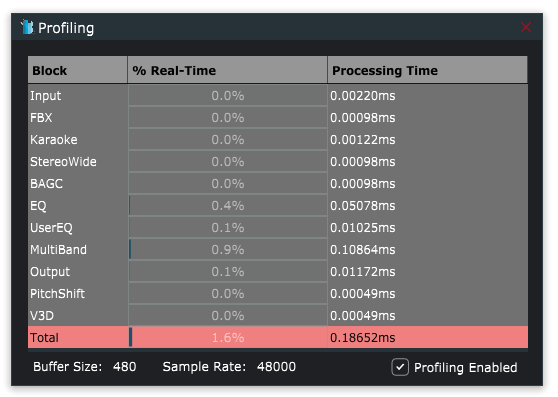
- Profiling – Provides CPU use of the algorithm on the target platform (if supported). The processing time of each component is provided in milliseconds. The percentage of real-time is calculated based on the sample rate and buffer size.
- Sample Rate drop-down menu – Force the target platform to calculate coefficients at the given sample rate (does not affect the platform’s actual sample rate).
- Click the Set button to apply the sample rate and force the calculations.
- Send raw bytes – Test individual commands by typing the hex values into the text space, then click Send.
- Throttle – Limit command Tx Rx messages to a given interval.
- Getters – A prototype function in testing
- Clear Log – Clears the debug window.