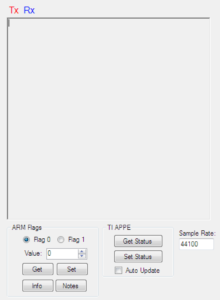
The Serial Debug window is used to visualize UART messages transmitted (Tx) or received (Rx) between the Profile Creator and a target platform.
Supported Platforms and Functions
- ARM M4f Platforms
- Includes BES and NUC505 platforms.
- NPCA12x platforms connect via the Nuvoton Bridge method.
- The Serial Debug window does not work when connected by the Nuvoton HID method.
- Download the Nuvoton Bridge manual here.
- All serial control messages are displayed here.
- These are handled by the DPSParseByte function on the ARM side.
- Flags
- Flags 0 or 1 are used to control preset loading or pass other messages between the DPS ARM code and a connected UART device.
- Each flag may be set on the ARM API or UART controller side.
- Each flag may be set to any 8 bit unsigned integer.
- Get – Click to get the value of the selected flag from ARM. The returned value is displayed in the Value text box.
- Set – Click to send the current Value to ARM.
- Info
- Click to read the current version and build information from ARM.
- Notes
- Click to read the current profile notes (saved in indices.c) from ARM. See the Notes feature for details.
- Includes BES and NUC505 platforms.
- TI APPE
- These controls are used to verify functions on the TI APPE Ethernet controller.
- Get/Set Status – Click to send/receive a packet from the TI APPE platform.
- Auto Update – This is on by default. When off, Set Status must be clicked to send an update to TI APPE.
- NOTE: DPS meters requests will generate a lot of messages in the UART debugging console. Use Menu->Settings->Disable Meters to temporarily stop these messages.
- Sample Rate – Manually set the sample rate of DPS on the TI APPE platform. This will only change the expected sample rate for DPS, not the target platform.
- Ethernet packet data is not displayed. Use Export->TI APPE to see the contents of a packet in idps.c format.
- Sunplus
- All messages sent/received from any DPS enabled Sunplus platform will be displayed here.